Yinan (Tom) Xuan  宣一楠

BPClip is a low-cost 3D-printed smartphone attachment for blood pressure monitoring that utilizes a smartphone's camera and flashlight. This device aims to make blood pressure measurement more accessible, particularly in resource-limited settings. By promoting the use of this affordable technology, the intention is to facilitate better management of hypertension and overall health for individuals worldwide.

Related Skills:

  • Software
  • Hardware

Figures

Figure 1
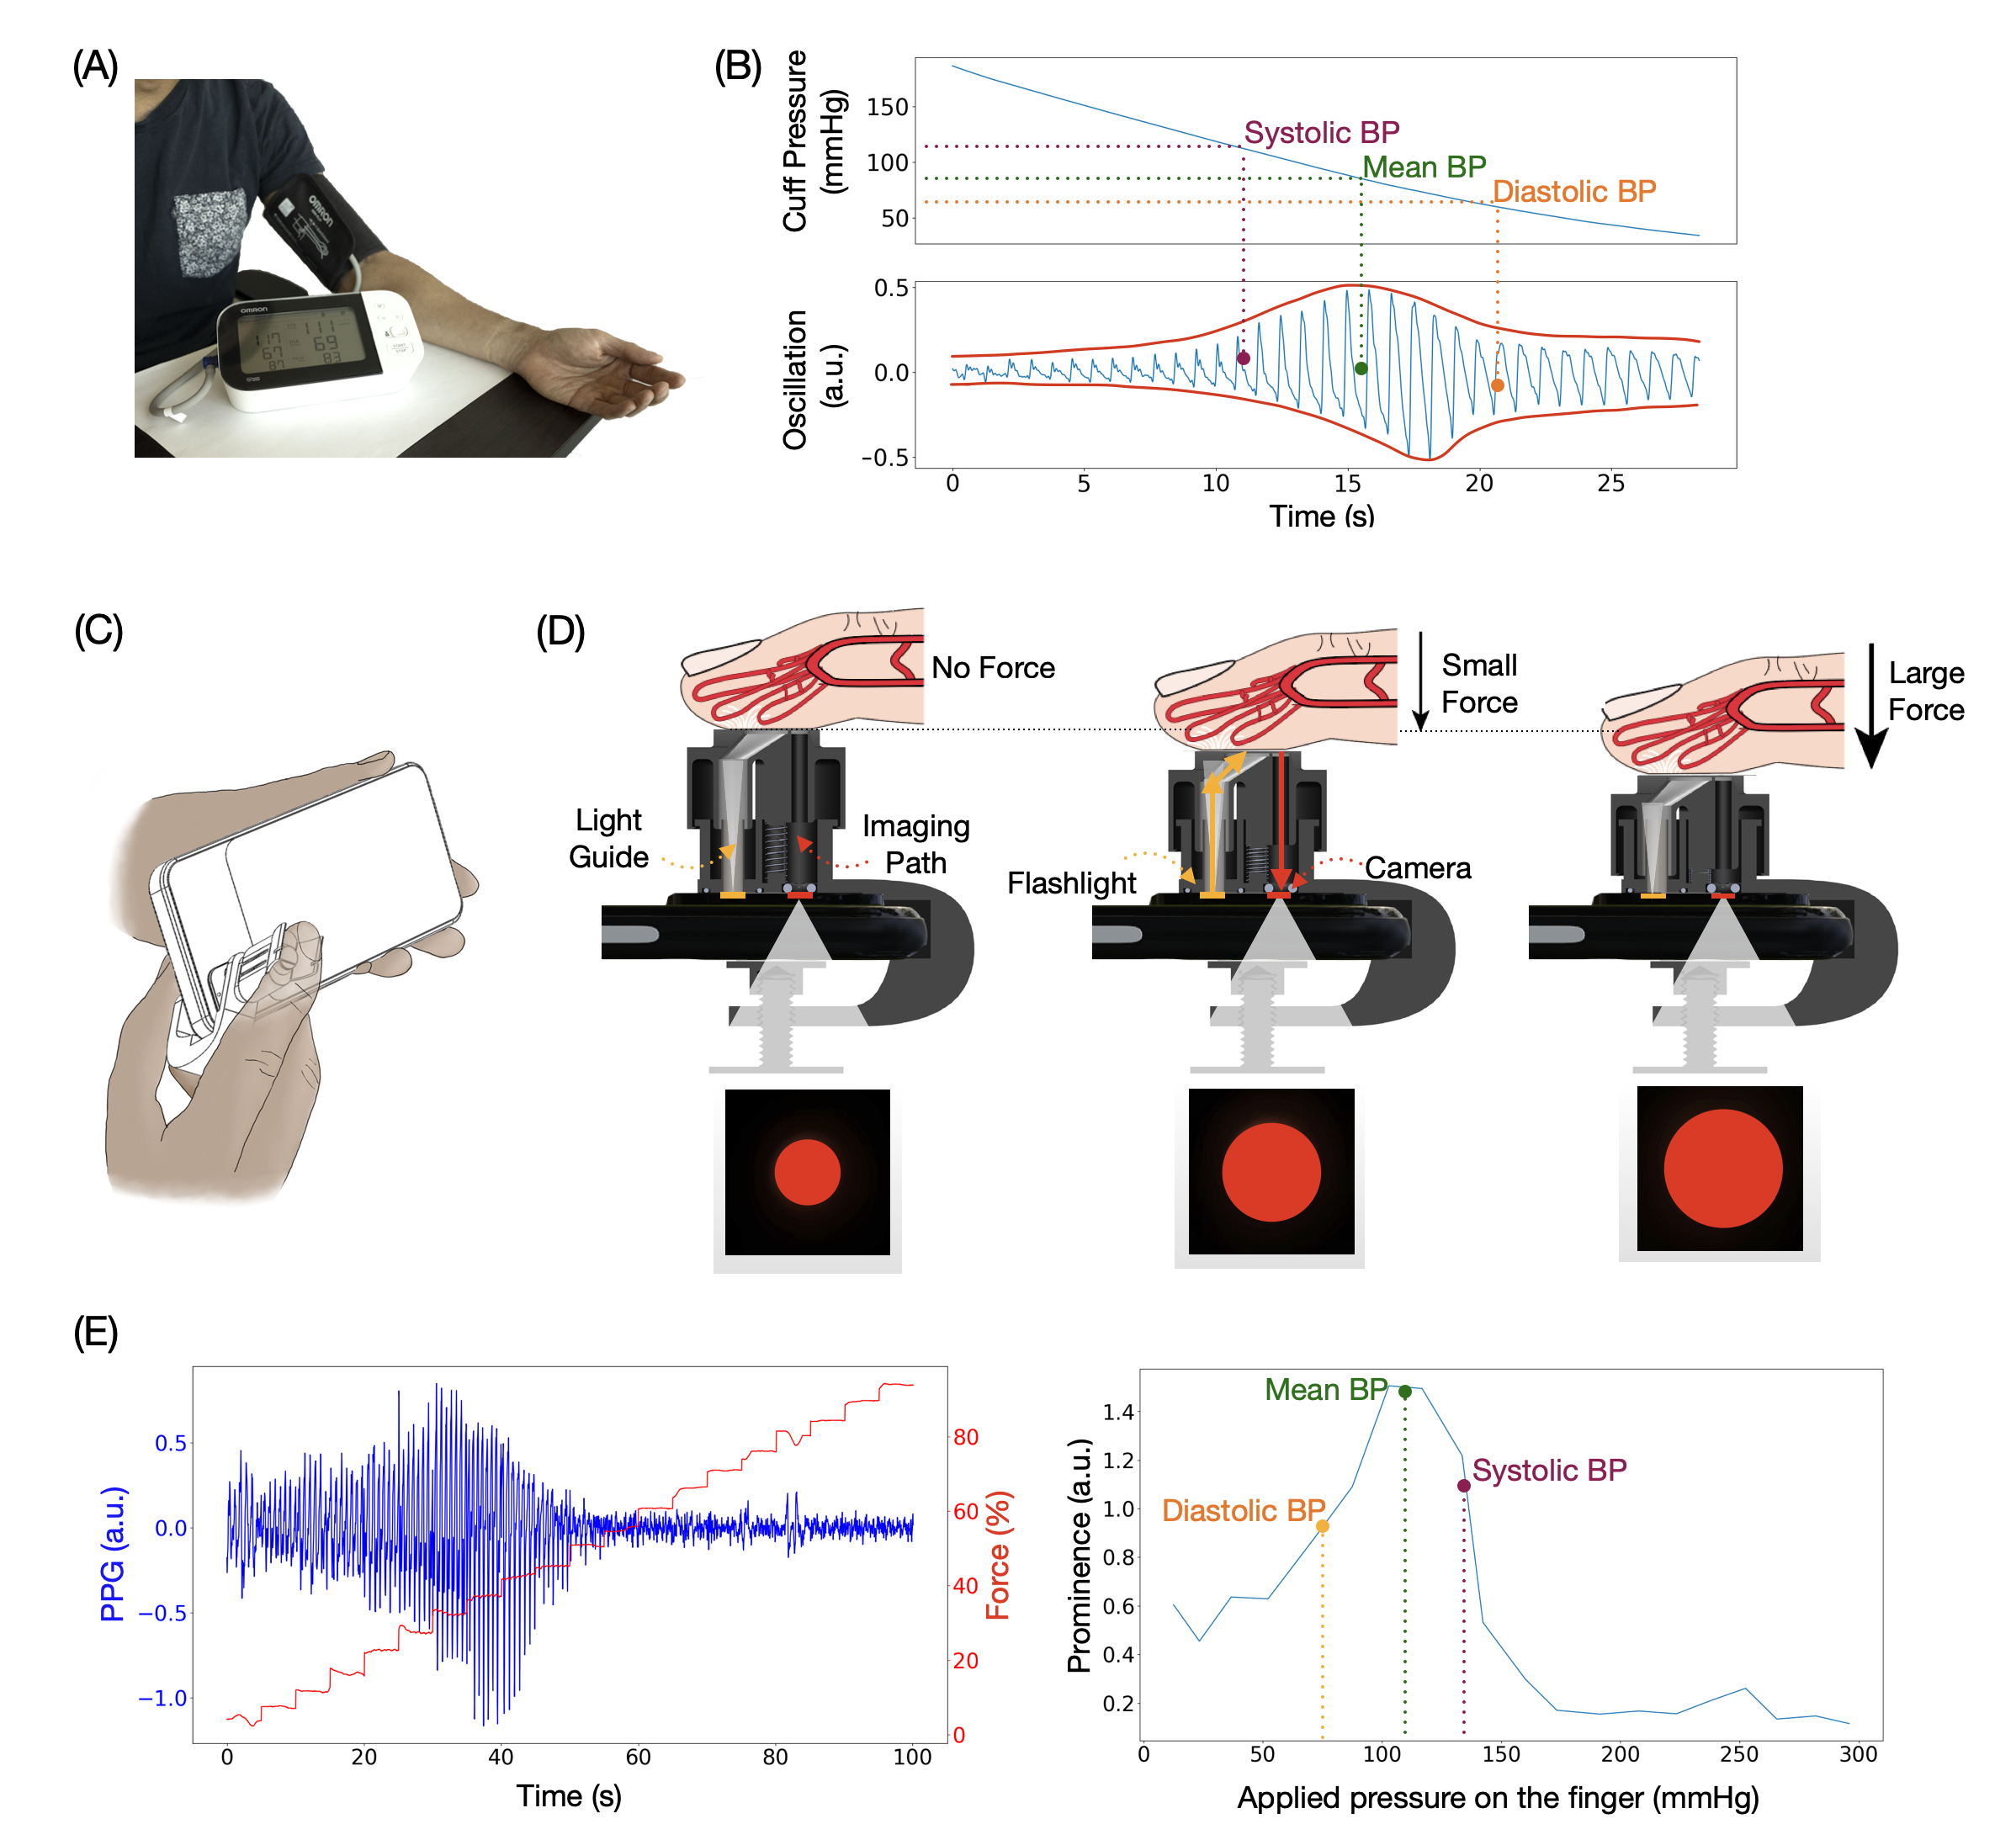
Figure 1: System Overview: Using finger oscillometry to calculate BP. (A) Cuff-based BP monitor (B) Example of an oscillogram obtained from an automated cuff. SBP, MBP, and DBP can be calculated from the shape of the envelope of the oscillogram. (C) Using BPClip to measure BP. (D) Light emitted from the smartphone flash travels through the light guide and illuminates the finger. The reflected light travels through the imaging path via a pinhole to reach the camera, forming an image of a red circle. The pulse information is encoded by the brightness of the circle. The pressing force information is encoded by the size of the circle. As the applied force increases, the circle diameter increases. (E) left: pulse and force data extracted from the red circle. right: oscillogram reconstructed from the data on the left.
Figure 2
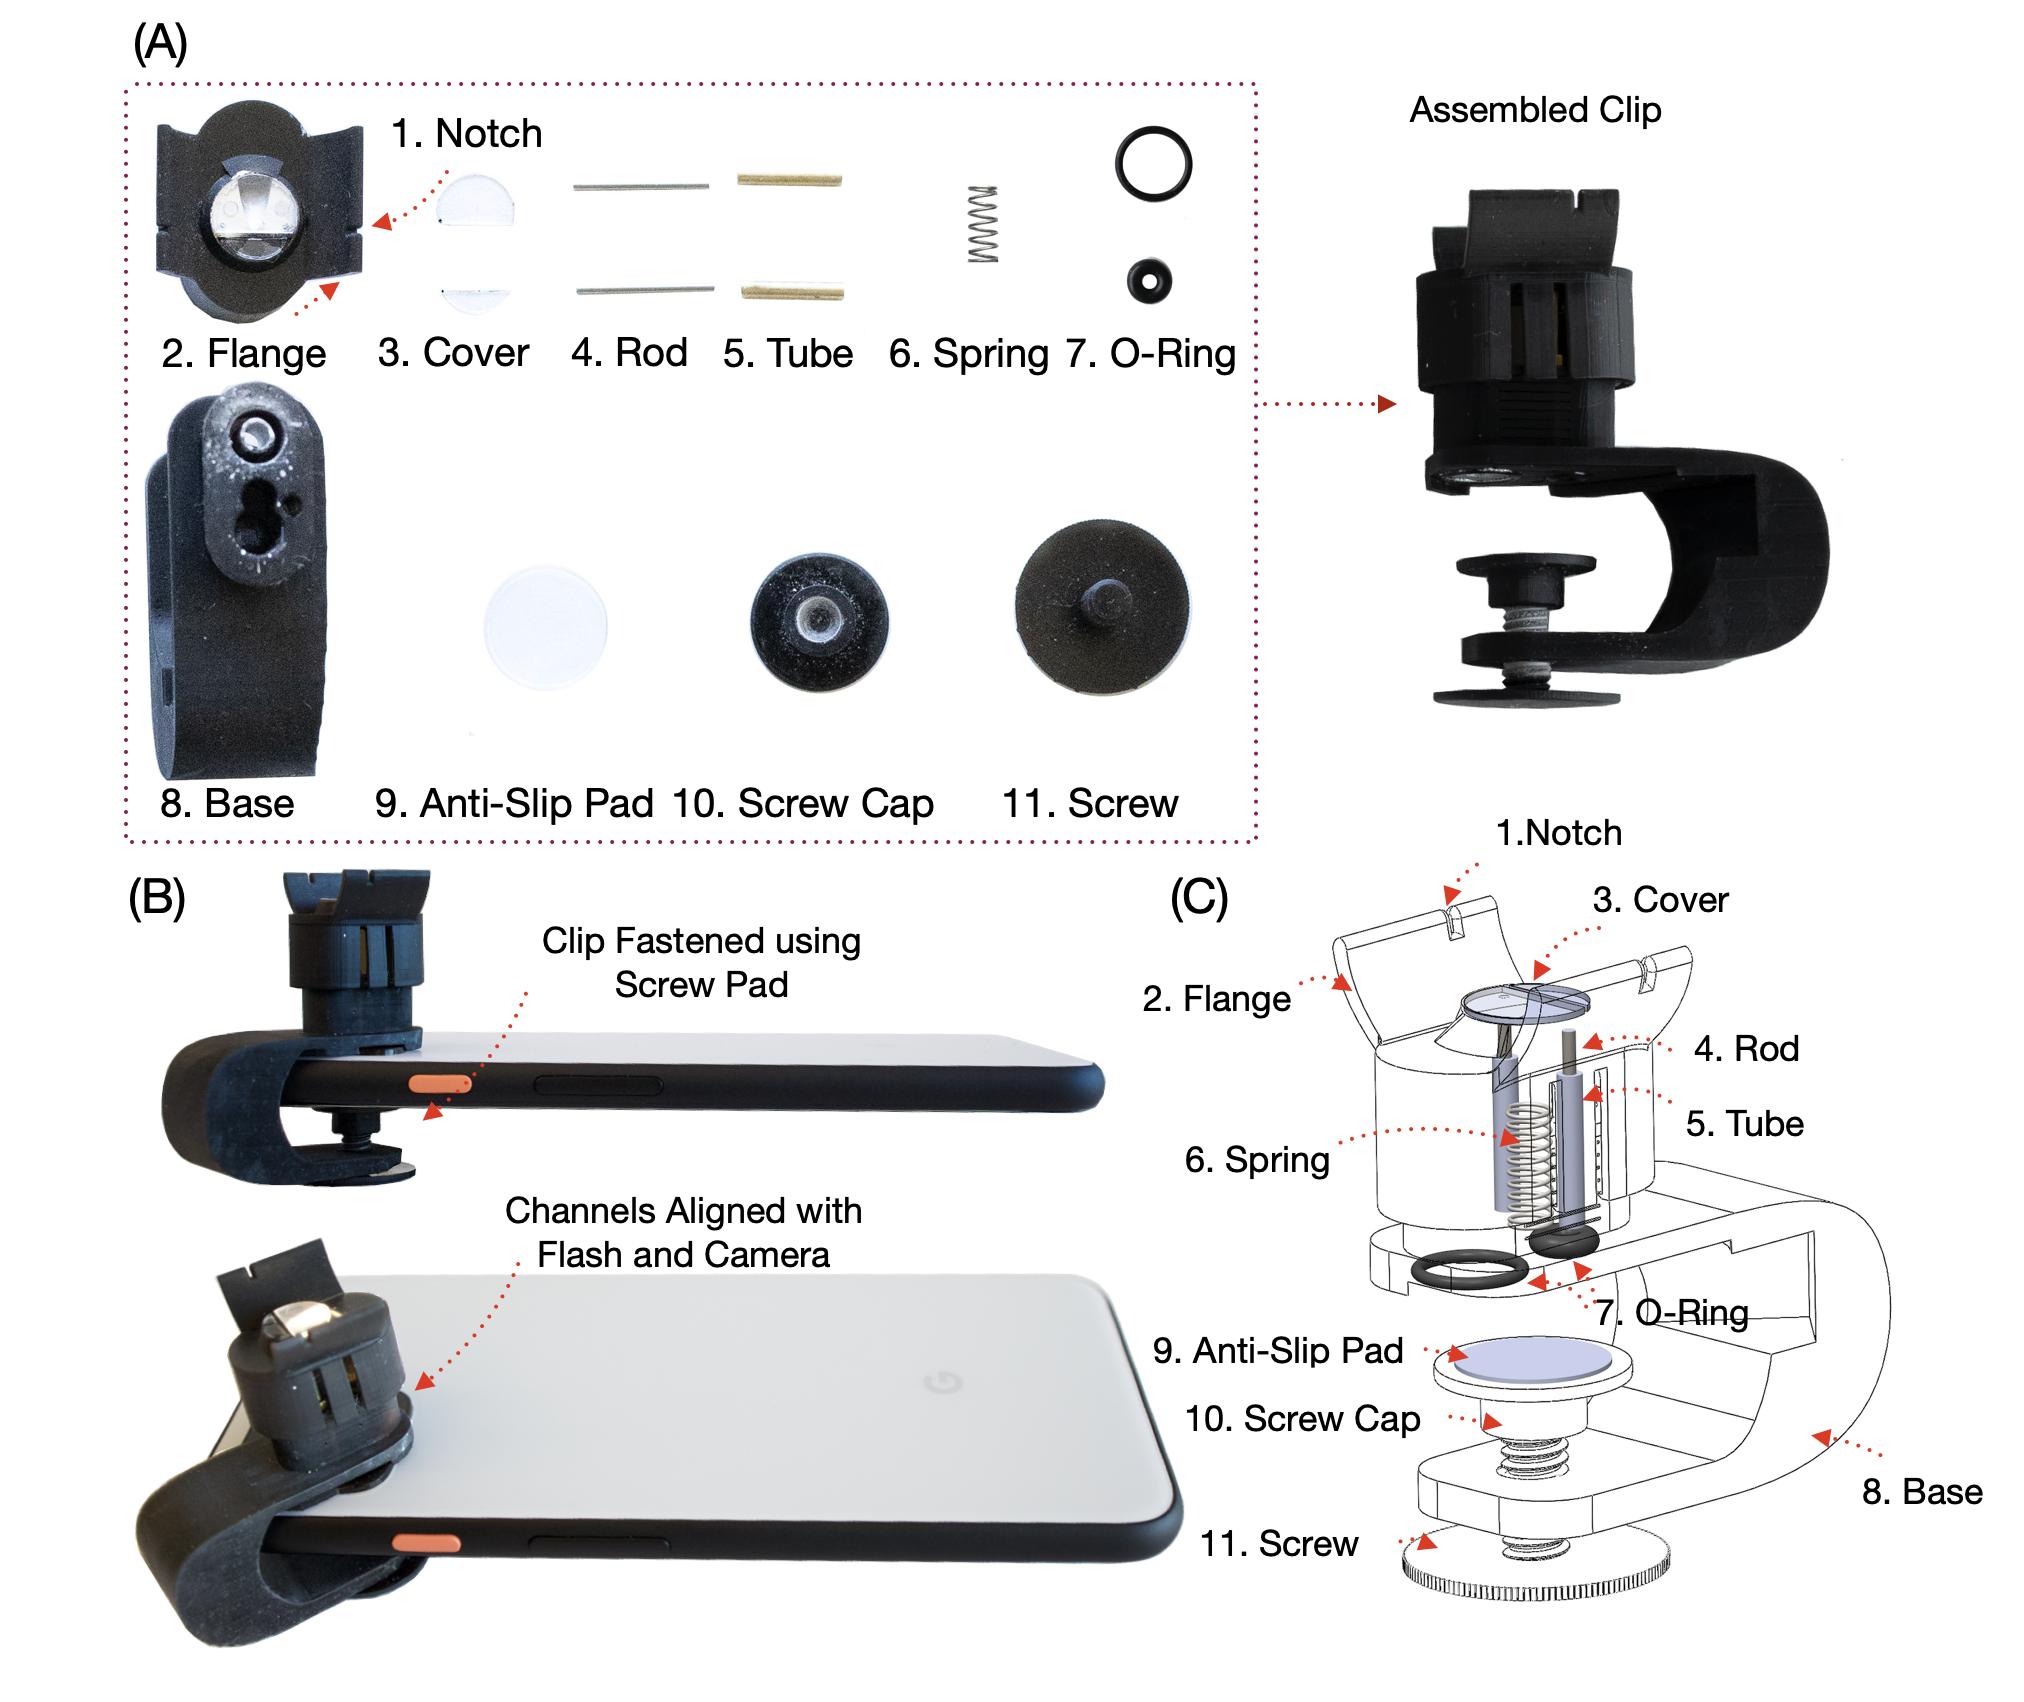
Figure 2: Prototype Component Diagram: Details of the hardware prototype (A) Fully assembled BPClip and disassembled components (B) BPClip mounted on a phone (C) X-ray view of assembled BPClip. Legend: 1. notch to align finger 2. flange to constrain finger angle 3. covers to ensure a flat pressing surface 4. rod to ensure smooth pressing 5. tube to ensure smooth pressing 6. spring 7. o-rings to avoid light leakage 8. clip base 9. anti-slip pad 10&11. clamp screw
Figure 3
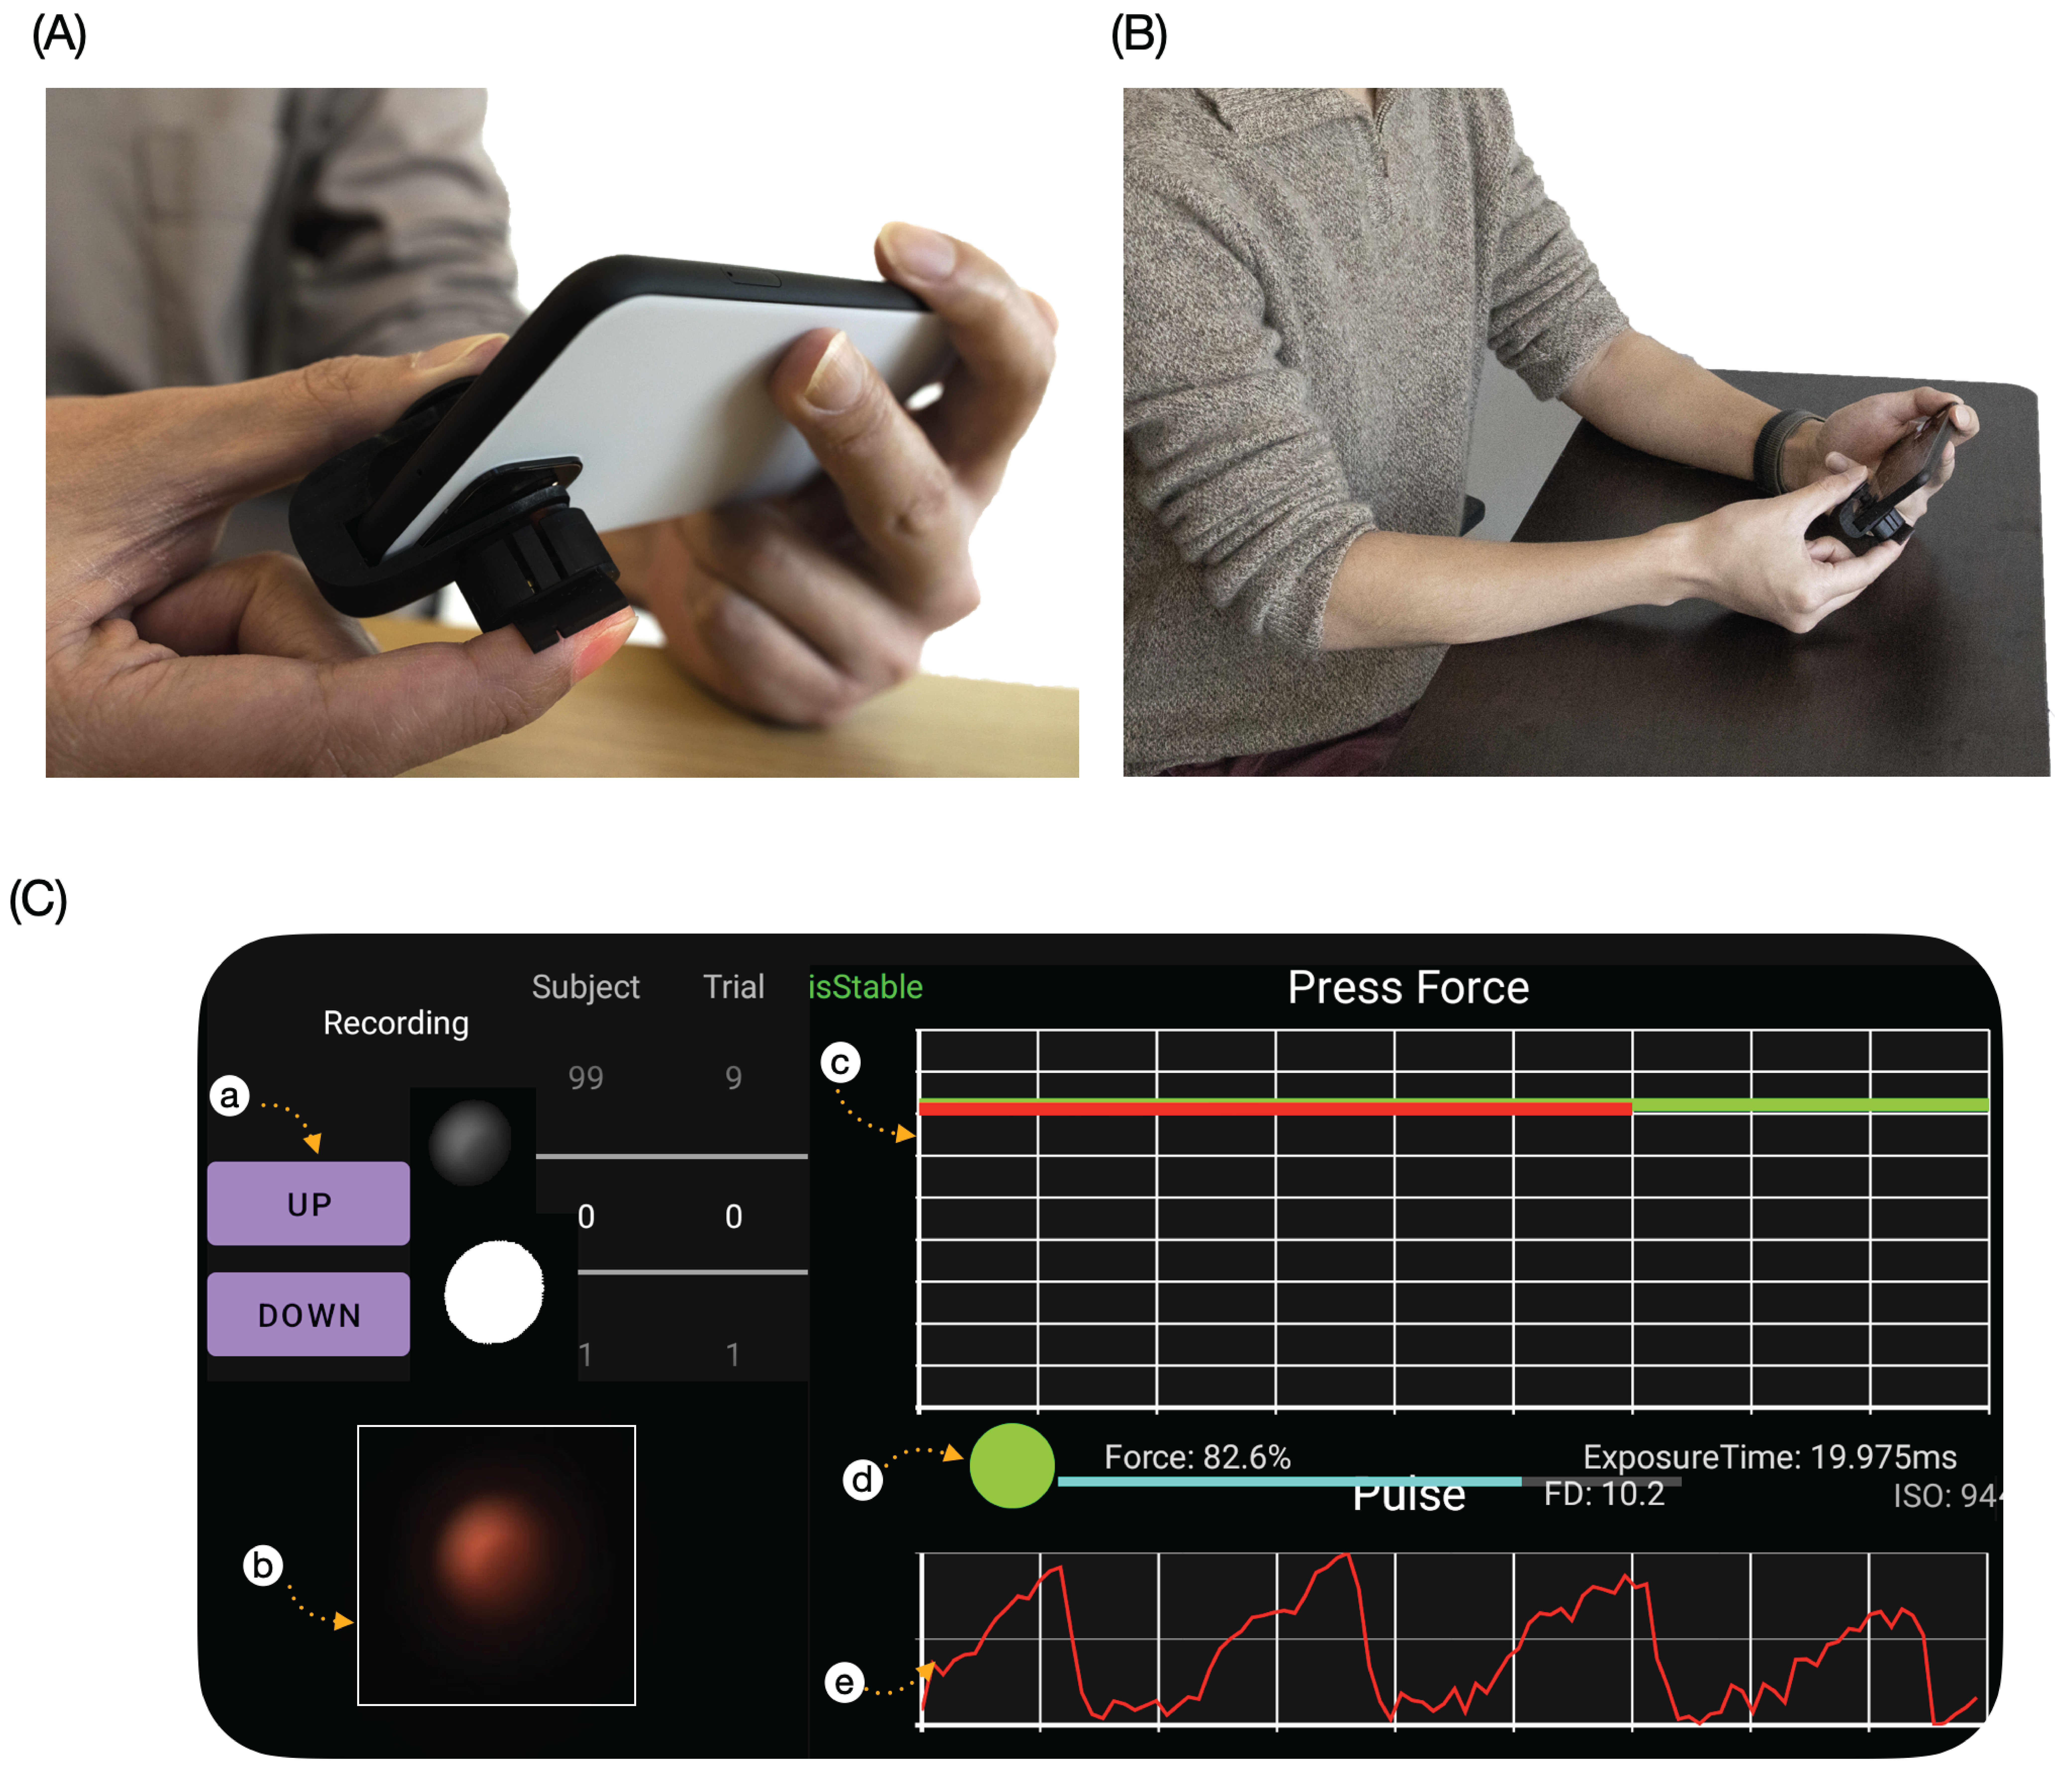
Figure 3: System Usability: Using BPClip (A) The base of the right index fingernail is aligned with the notch. (B) The user holds the phone and clip, with BPClip at heart level. (C) The (user interface) UI layout of the app. Legend: a. button to record force range adjustment b. real-time camera image preview c. Force indicator, red line indicates the current force, green line indicates the target force level d. force range indicator. Red circle indicates the force is out of range. Yellow circle indicates the force is within the range, and the user needs to hold for 2 more seconds to start data recording. Green circle indicates the data is currently being recorded and a 5-second progress bar will show up e. real-time pulse signal display
Figure 4
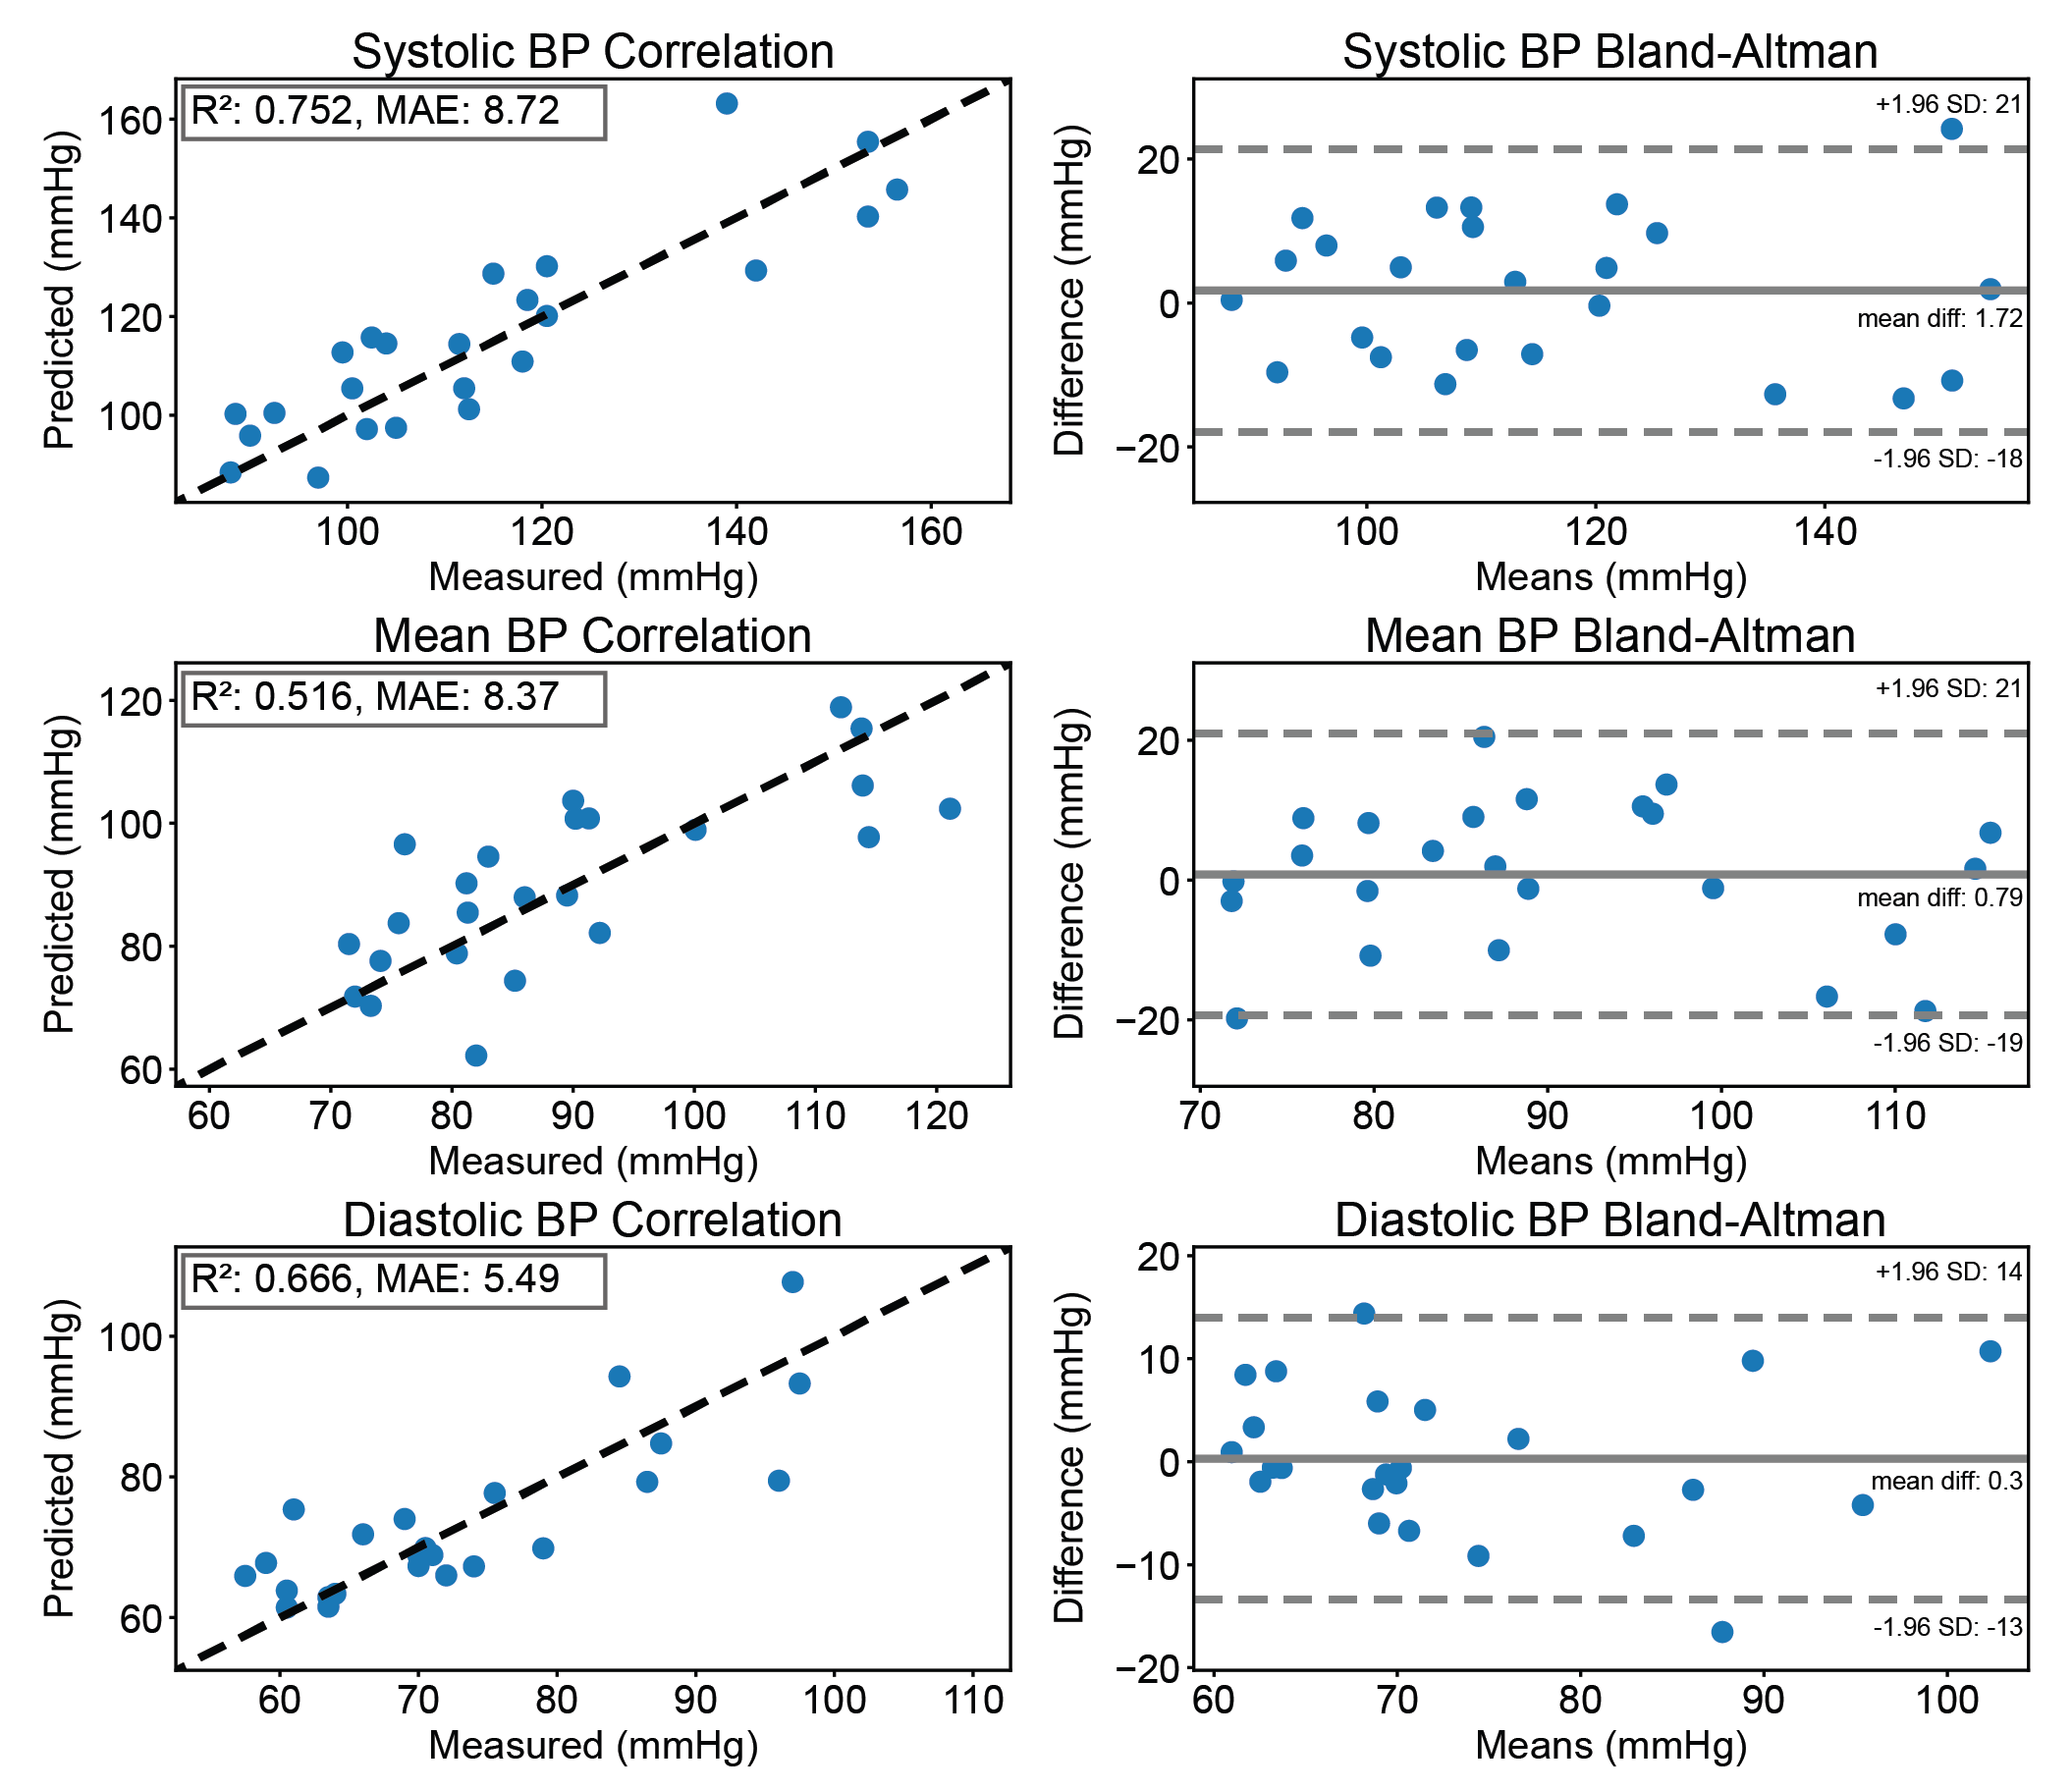
Figure 4: Blood Pressure Estimation Accuracy: Accuracy of blood pressure estimation with Leave-Two-Subjects-Out Validation (12-fold cross-validation with N=24 subjects) shown in correlation and Bland-Altman plots. The dashed lines in correlation plots represent the best-fit line, where the measured value equals the predicted value.

BPClip Concept Illustration Video


BPClip Use Demonstration Videoo